Tutorial
You can use the interactional discourse lab tool on your own transcripts by simply annotating your file and uploading it to the application's page. This tutorial explains the format used by the tool and describes the statistics it offers.
Click here to launch the tool.
Annotating your file
Your transcript must follow a specific format in order to be processed. It must be a text file, with one turn per line, starting with the speaker's name, then a space or a tabulation, then the content of the utterance. If the turn is annotated (or 'tagged'), the tag is placed at the end of the turn, separated by a forward slash (/).
In the following example, we consider two turns. Markus speaks first, then Cecilia. Only Cecilia's turn is tagged, with 'upshot'.
MARKUS Lorem ipsum dolor sit amet, consectetur adipisicing elit, sed do eiusmod tempor incididunt ut labore et dolore magna aliqua.
CECILIA Duis aute irure dolor in reprehenderit in voluptate velit esse cillum dolore eu fugiat nulla pariatur. /upshot/
Download the following well-formatted file as an example: sampleIDLab.txt
Uploading your file
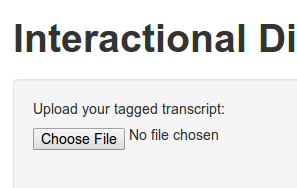
Once your file is correctly formatted, upload it on the application's page by clicking Choose file at the top of the grey banner and selecting the file on your computer.
For this tutorial, we'll use the file sampleIDLab.txt as an example. Download it on your computer,
extract it from the zip file, launch the application and upload it on the tool.
This file contains a simulated transcripts with 1500 turns, five speakers (Antonio, Sebastian, Fabian, Maria and Olivia)
and 4 tags (check, upshot, consequence, explanation).
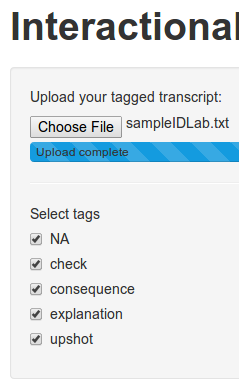
Once the file is uploaded, it is parsed and processed. The grey bar on the left hand-side shows all the tags that have been identified. The value NA is assigned to untagged turns.
Once the file is uploaded and parsed, IDLab displays a number of graphs and statistics in 3 separate panels: Speakers and Tags, Interactions and Timeline.
All tags are selected by default. When you select/unselect a tag, the statistics and graphs are automatically updated.
Speakers and tags
This panel shows a number of relevant global statistics about the differential tag usage and speaker participation.
Summary
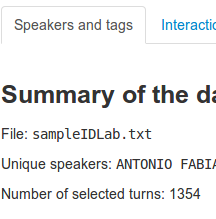
A summary of the data is provided, as a sanity check. You can see the name of the file that is being processed, the number of turns and the list of speakers.
The number of selected turns will change with the tag selection; unselect the untagged turns (NA)
for example, and it will change from 1500 to 1354.
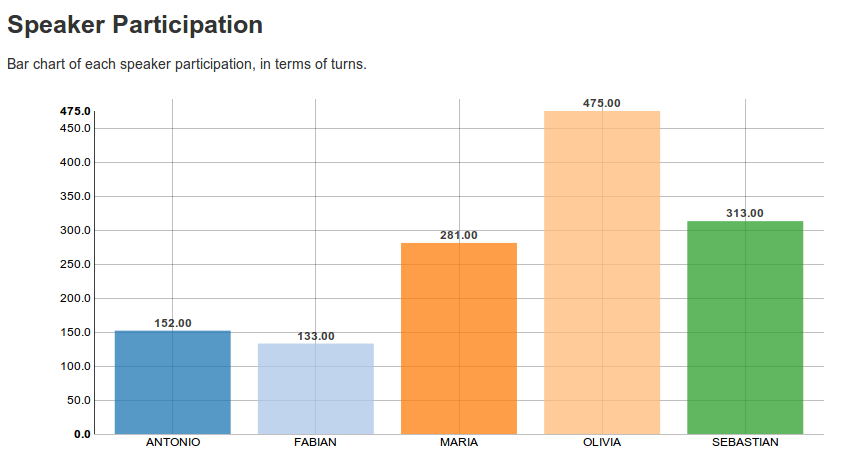
Speaker participation
This graph shows each speaker's participation, in terms of turns, as a bar chart.
This gives you an idea of how much each speaker has contributed to the meeting.
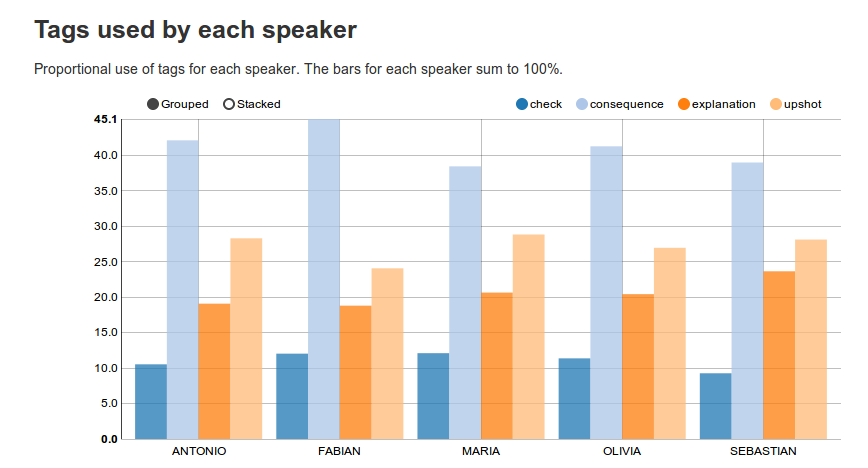
Tags used by each speaker
These bar charts represent the differential tag usage for each speaker.
The bars for each speaker sum to 100%.
Click on Grouped/Stacked if you're either interested in comparing tag usage between speakers, or in the tag usage for an individual speaker.
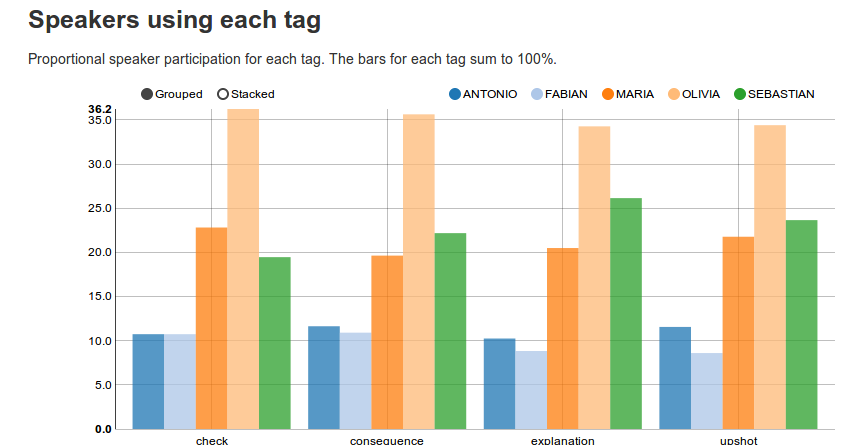
Speakers using each tag
These bar charts represent how much each speaker uses the same tag.
The bars for each tag sum to 100%.
Click on Grouped/Stacked if you're either interested in comparing a speaker across tags, or in the distribution of speakers for a specific tag.
Interactions
This panel shows two networks: the tag network and the speaker network. The networks represent the amount of interaction between tags or speakers. From one node, each outgoing arrow represents the frequency with which the next node appears.
One way to read a network is to start with one arbitrary node, select the next according to each of the out-going arrows and iterate. This effectively simulates a meeting with the same statistics as the one recorded in the transcripts.
Networks are useful to identify patterns in turn-taking (who speaks after whom) and tag usage.
The size of the node relates to either the global tag usage or speaker participation.
The tables shows the estimated value, as well as the lower and upper values of the 95% confidence interval. If the number of turns is low (e.g. less than 200) the confidence intervals can be large.
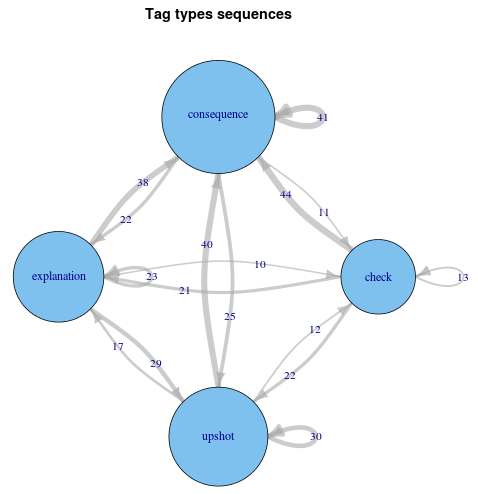
Interactions between tags
With this network, you can follow the sequence of contiguous tags in your transcript and identify revealing motifs.
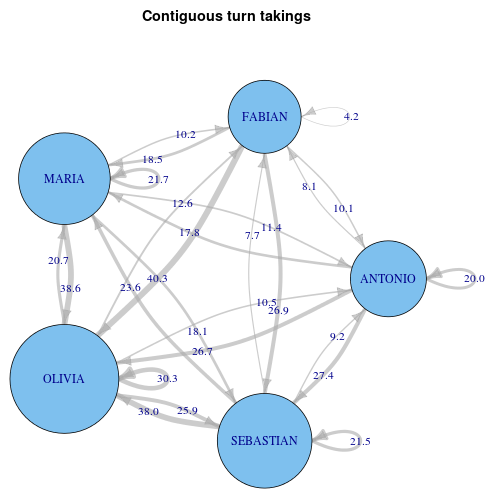
Interactions between speakers
With this network, you can read the turn-taking events that took place in your transcript. It is, for example, for checking whether junior members talk after senior members etc..
Timelines
Rather than the average pictures provided by the bar charts and the networks, the timelines show you every individual turn.
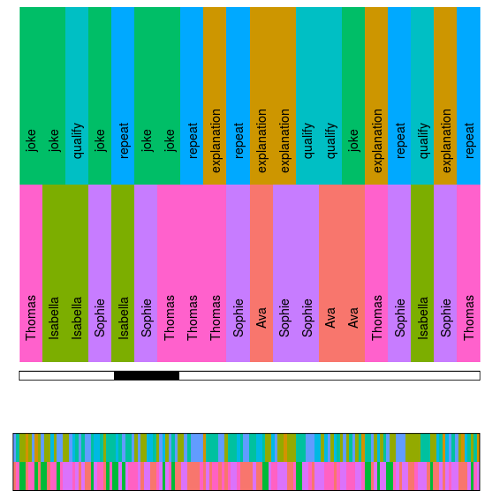
Select only the tags explanation and upshot. You should have the following graphs:
This timeline represents the speakers (top) and the tag (bottom), for each turn. Time runs on the x-axis.
Use the two sliders to explore the timeline.
The bottom picture shows the totality of the spoken discourse.
Saving
This panel gives you access to a saving option, which appears on the grey column on the left hand-side.
Clicking on this button produces an automatic report in pdf format with all the graphs (bar charts, networks and time line) provided by the tool. The report contains a copy of the graphs currently shown, as calculated from the current selection of tags.
The generation of the report can take a few seconds.
Technical notes
The tool is entirely written in R, a programming language designed for statistics and data analysis.
It uses the following packages:
Ggplot2andrChartsfor the bar charts and the time line.Shinyfor the web interface.iGraphfor the networks.stringranddplyrfor parsing and reshaping the data.MultinomialCIfor calculating the confidence intervals.rmakrdownfor thepdfreport.